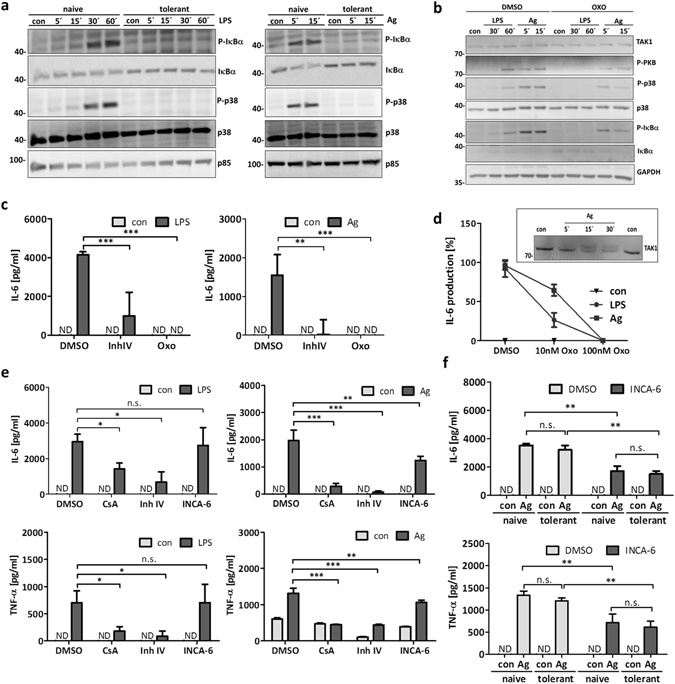
Figure 6.

Differential activation of signalling pathways in tolerant cells in response to antigen stimulation. To induce ET, BMMCs were treated with LPS (300 ng/ml) for 24 h and loaded with IgE (150 ng/ml) overnight. Naive and tolerant cells were stimulated with LPS (1 µg/ml) or Ag (DNP-HSA; 20 ng/ml) for indicated times. Immunoblotting against P-IκBα, IκBα, P-p38, p38 and p85 (loading control) was performed (a). Additionally, cells were incubated with the TAK1 inhibitor (5Z)-7-Oxozeaenol (Oxo; 300 nM) for 30 min and stimulated with LPS or Ag for indicated times. Subsequently, Western blotting was performed with antibodies against TAK1, P-PKB, P-IκBα, IκBα, P-p38, p38 and GAPDH (loading control) (b). Western Blots are representative of three independent experiments. Furthermore, BMMCs were incubated with Oxo (300 nM) for 30 min and stimulated with LPS or Ag for 4 h to analyse IL-6 production (c). Data show mean ± SD from n = 3 independent experiments. Two-sided ANOVA with Dunnet’s post-hoc test was performed to calculate p-values. To analyse the differential effect of Oxo on IL-6 production, BMMCs were treated with 10 nM and 100 nM Oxo and then left unstimulated (con) or stimulated with LPS and Ag for 4 h (d). Data show mean ± range from n = 2 independent experiments each measured in triplicates. Moreover, IgE-preloaded BMMCs were left unstimulated (con) or stimulated with Ag for indicated times and TAK1 was detected by Western blotting; shown in the insert to (d). Furthermore, BMMCs were treated with Cyclosporin A (CsA; 0.1 µM), IKK-β inhibitor InhIV (3 µM), and INCA-6 (3 µM) for 1 h and then stimulated with LPS and Ag for 4 h to measure IL-6 and TNF-α secretion (e). Data show mean ± SD from n = 3 independent experiments. Two-sided ANOVA with Dunnet’s post-hoc test was performed to calculate p-values. Tolerant and naive BMMCs were incubated with INCA-6 (3 µM) for 1 h and stimulated with Ag for 4 h to measure IL-6 and TNF-α production (f). Data show mean ± SD from n = 3 independent experiments. Student’s t-Test was performed to calculate p-values. *p < 0.05, **p < 0.01, ***p < 0.001.
