
Figure 4.
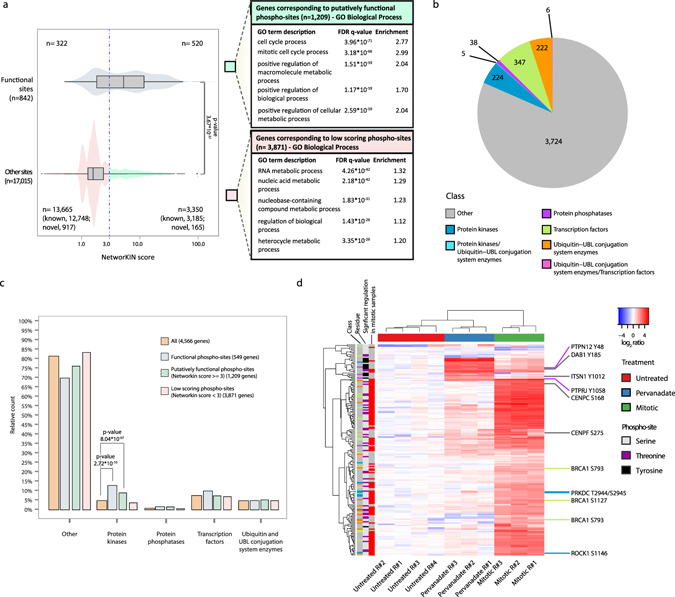
Novel phospho-sites have putative roles in mitotic regulation. (a) NetworKIN score distributions for the subsets of known functional phospho-sites or phospho-sites with no known function (Other sites). Two-sided t-test was performed to assess significance. A threshold score of 3 is used to separate a population of putatively functional phospho-sites and GO Biological Process enrichment analysis is performed on the score separated populations. (b) Number of genes identified for each of the examined classes in the phospho-HiRIEF analysis. Genes ascribable to more than one class are indicated in separate groups, with the classes separated by a “/” character. (c) Relative distribution of genes across classes for the subsets of genes corresponding to functional, putatively functional or low-scoring phospho-sites. Class enrichment in each subset compared to the class distribution for all genes identified in the Phospho-HiRIEF analysis is evaluated by Fisher exact test. Genes attributable to more than one class were excluded from this analysis. (d) Heatmap representing hierarchical clustering based on Euclidian distance and complete linkage of putatively functional novel phospho-sites. Row color-codings represent: “Class”, class of the protein carrying the indicated phospho-site (color coding as in Fig. 4b); “Residue”, modified residue; “Significant regulation in mitotic samples”, red – significant, grey - not significant. Detailed list of the phospho-sites included in the heatmap is provided in Supplementary Data S5.