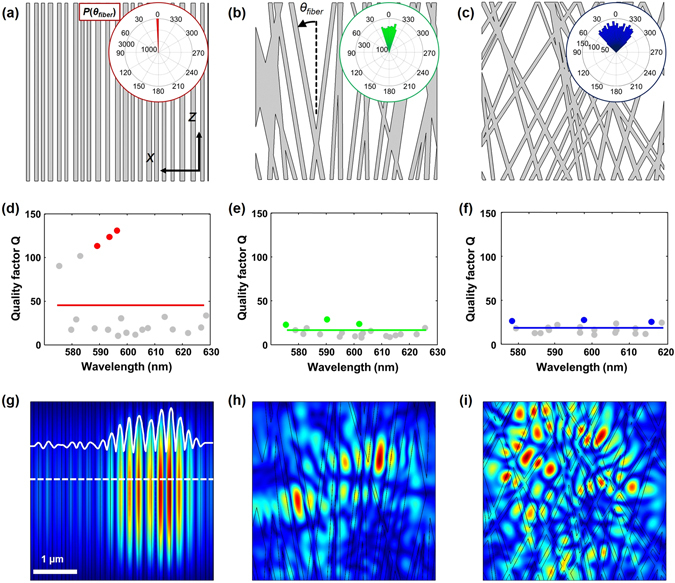
Figure 4.

(a–c) SF nanofiber configurations for the FEM quasi-mode analysis. Histograms of the angular distribution of the SF nanofibers are presented in the insets of (a–c). (d–f) Quality factors as a function of wavelengths for the three cases. Solid lines denote the Q AVE. (g–i) Amplitudes and spatial distributions of the electric fields corresponding to the three modes with the highest Q factors. These modes are indicated by the red, green and blue dots in (d–f), respectively.
