
Figure 1.
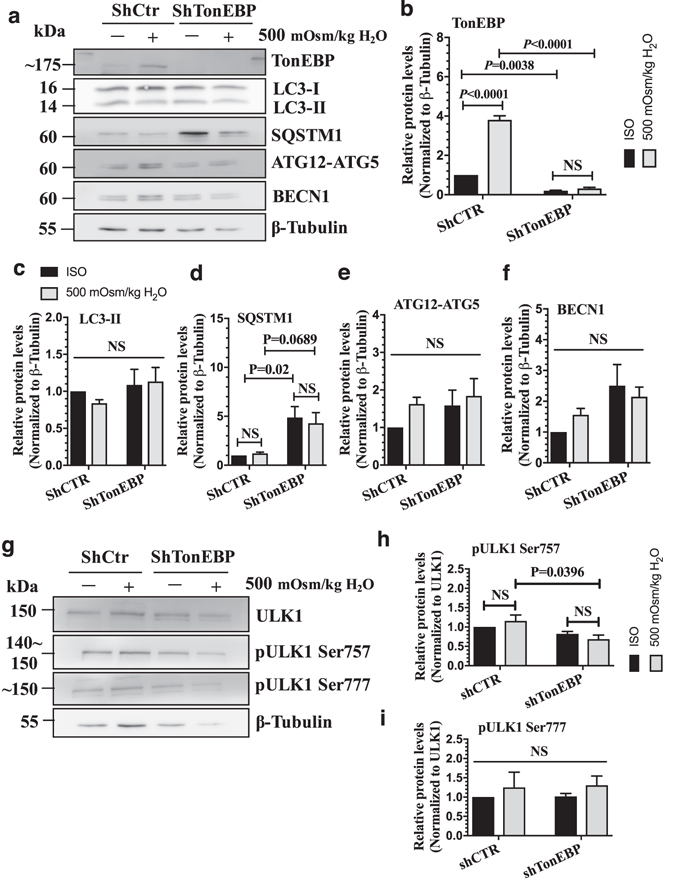
TonEBP does not control autophagy in NP cells. (a) Western blot analysis of NP cells transduced with a lentivirus expressing either control shRNA or shTonEBP plasmid showed that TonEBP silencing did not affect the levels of LC3-II, ATG12-ATG5, and BECN1. The levels of SQSTM1 increased with TonEBP silencing. (b–f) Densitometric analyses of multiple Western blots shown in (a). (g) Western blot analysis of ULK1 activation status showed that the levels of pULK1 Ser757 was slightly lower, while that of pULK1 Ser777 remained unaffected after TonEBP knockdown under hyperosmotic conditions. (h,i) Densitometric analyses of multiple western blots shown in (g). Bars represent mean ± SEM (n = 4). Two-way ANOVA with Tukey’s multiple comparisons test was used to determine statistical significance. NS, non-significant. Western blot images were cropped and acquired under same experimental conditions. See Supplementary Fig. S1 for examples of uncropped images.