
Figure 4.
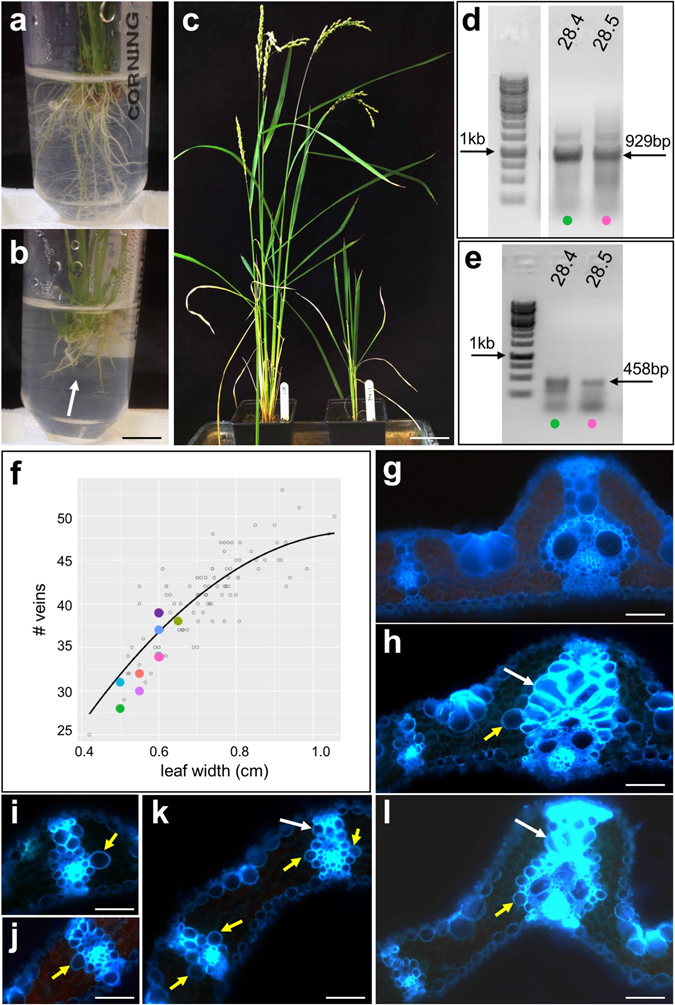
Transgenic lines overexpressing a protein of unknown function exhibit aberrant lignification around vascular bundles. (a–c) Compared to non-transgenic roots (a) and shoots (c) - left hand panel), growth of transgenic roots (b) and shoots (c)- right hand panel) is stunted. (d,e) Cropped gel images of genomic (d) and RT- (e) PCR reactions illustrate transgene presence and transcript levels in two representative T0 lines. (f) Regression plot showing vein number versus leaf width for 8 independent T0 lines. (g,l) Transverse cross sections of wild-type (g) and transgenic (h–l) leaves showing enhanced number of thicker walled sclerenchyma cells (white arrows) and enlarged and/or ectopic cells around veins (yellow arrows). Coloured circles in (d,e) illustrate corresponding datapoints in (f). Scale bars = 1 cm (a); 8 cm (b); 70 µm (g,h,l); 60 µm (i–k).