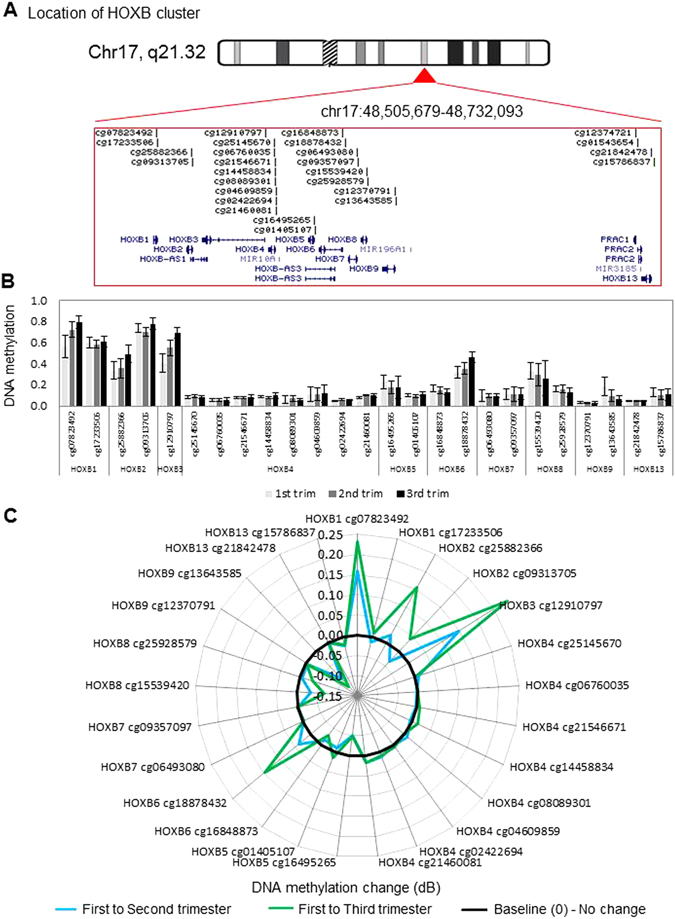
Figure 2.

DNA methylation levels and dynamics at the HOXB gene cluster. (A) Location and organization of the HOXB gene cluster on chromosome 17, with the location of genes and HM27 probes shown. (B) As in Fig. 1 legend above but for HOXB locus, sorted by gene. For first, second and third trimester, n = 18, 10, and 14 were used, respectively. Error bars are standard deviation. (C) As in Fig. 1 legend above but for each probe within the HOXB cluster in second and third trimester, relative to first trimester placenta. Black line marks 0 (no change in methylation), positive values indicate increase in methylation and negative values indicate decrease in methylation over gestation.
