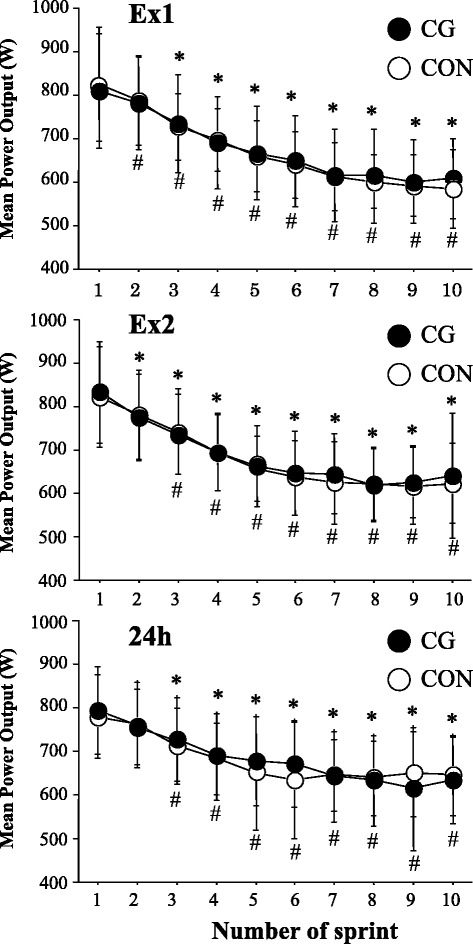
Fig. 4.

Power output during repeated sprint test. Values are means ± SD. *P < 0.05 vs. the value in the first sprint (CG); # P < 0.05 vs. the value in the first sprint (CON)

Power output during repeated sprint test. Values are means ± SD. *P < 0.05 vs. the value in the first sprint (CG); # P < 0.05 vs. the value in the first sprint (CON)