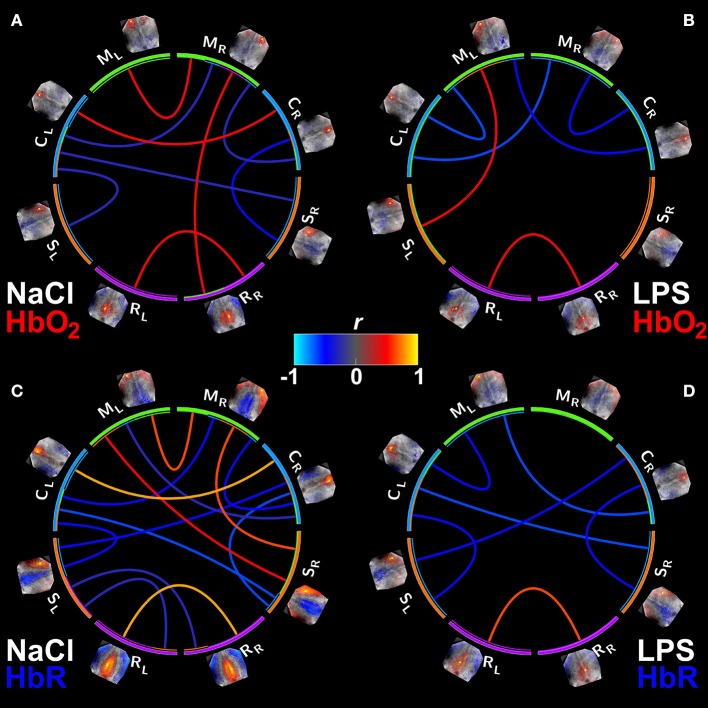
Figure 1.
Group mean connectivity matrices visualized with Circos (Krzywinski et al., 2009). (A,B) Show the connectivity matrices for HbO2 contrast from the NaCl and LPS groups, respectively. (C,D) Same as (A,B) but for HbR. Supra-threshold edges are shown (FDR-corrected p < 0.05). M, motor cortex; C, cingulate cortex; S, somatosensory cortex; R, retrosplenial cortex. Subscripts L and R indicate hemisphere side. Note the significant reduction in connectivity in animals exposed to inflammation with a larger effect on HbR contrast.

