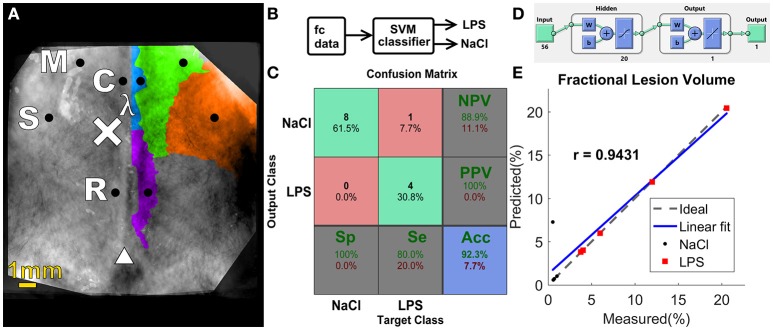
Figure 5.
(A) Functional regions on the rat cortex, seed placement and size, manually constructed from data shown by Jung et al. (2013). Black circles indicate seed position and size. Injection site is denoted by the “×” symbol, lambda denoted by λ and bregma indicated by triangle symbol. M, motor; C, cingulate; S, somatosensory; R, retrosplenial. (B) Block diagram of the proposed classifier (C) Confusion matrix for the SVM classifier. (D) Graphical diagram of the ANN. (E) Regression plot for ANN predicted ventricular size vs. measured ventricular size.

