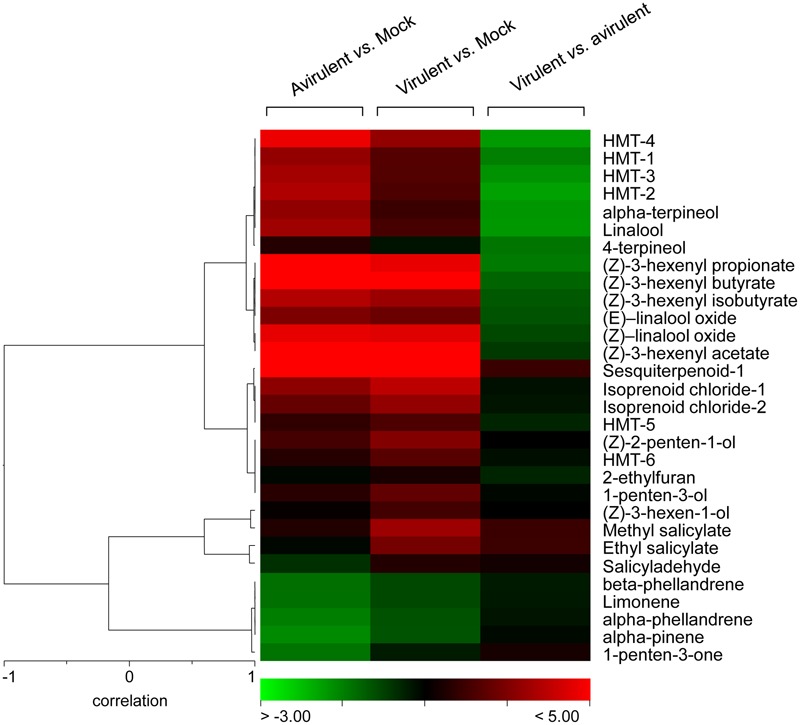
FIGURE 5.

Hierarchical cluster of the volatile compounds from infected plants. Log2-transformed ratios are represented as a heat map according to the scale below. Red corresponds to higher values; green denotes lower values. Column 1 represents the ratios of the VOCs emitted by the tomato plants infected with avirulent strain Pst DC3000 versus the mock-inoculated tomato plants. Column 2 represents the ratios of the VOCs emitted by the tomato plants infected with virulent strain Pst DC3000 ΔavrPto/ΔavrPtoB versus the mock-inoculated tomato plants. Column 3 represents the ratios of the VOCs emitted by the tomato plants infected with virulent strain Pst DC3000 ΔavrPto/ΔavrPtoB versus the tomato plants infected with avirulent strain Pst DC3000.
