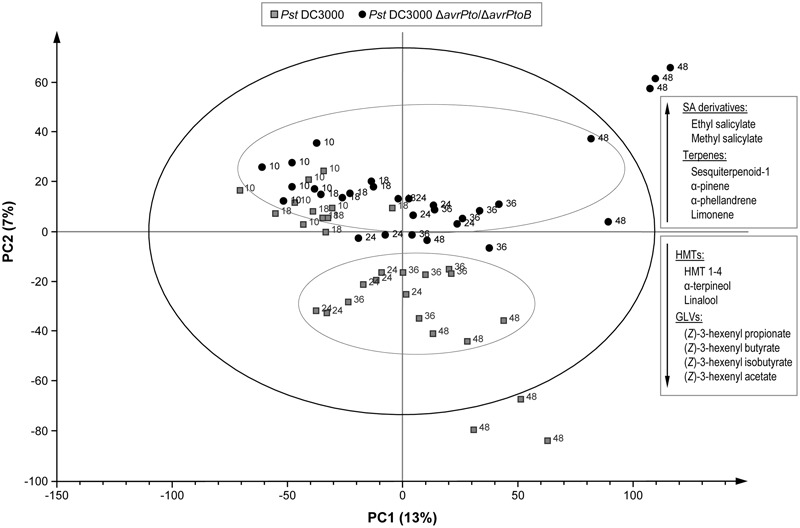
FIGURE 6.

Score plot of the PLS based on the whole array of the mass spectra within a m/z range from 35 to 250. ( ) Leaves of the RG-Pto plants upon infection Pst DC3000, (●) leaves of the RG-Pto plants infected with Pst DC3000 ΔavrPto/ΔavrPto at 10, 18, 24, 36, and 48 hpi. Metabolites displayed in the boxes were identified by loading plot analysis as the responsible for the observed separation.
