Table 3.
Evaluation of diastolic, systolic and stroke volumes using three shape models through three post-embryonic stages (56, 80, and 104 hpf) of mahi.
| MAHI LARVAE | |||||
|---|---|---|---|---|---|
| Shape models | Volume (nL) | 56 hpf | 80 hpf | 104 hpf | |
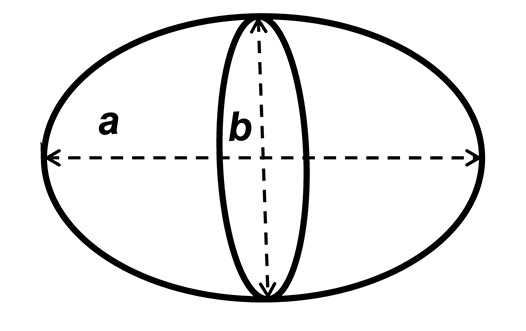
| Prolate spheroid |  |
VDIA | 0.31 ± 0.02α | 0.40 ± 0.03δ | 0.98 ± 0.12κ |
| VSYS | 0.17 ± 0.02α | 0.26 ± 0.3δ | 0.58 ± 0.07κ | ||
| VSV | 0.14 ± 0.01α | 0.14 ± 0.02δ | 0.40 ± 0.07κ | ||
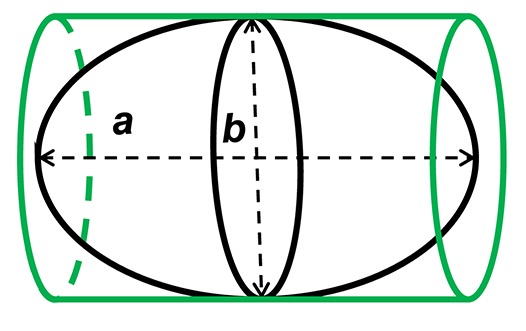
| Cylinder (100%) |  |
VDIA | 0.44 ± 0.03β | 0.54 ± 0.04ε | 1.31 ± 0.17κ |
| VSYS | 0.23 ± 0.02α | 0.32 ± 0.03δ | 0.76 ± 0.10κ | ||
| VSV | 0.21 ± 0.02β | 0.22 ± 0.02ε | 0.54 ± 0.11κ | ||
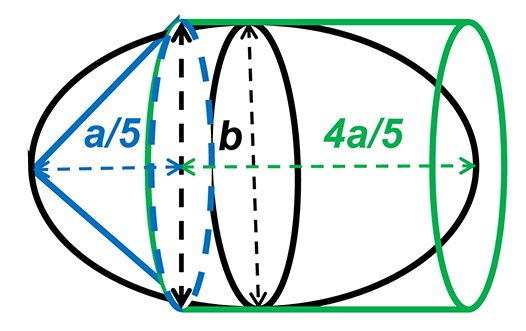
| Cone tip (20%) + cylinder (80%) |  |
VDIA | 0.38 ± 0.02αβ | 0.47 ± 0.03δε | 1.13 ± 0.15κ |
| VSYS | 0.20 ± 0.02α | 0.28 ± 0.02δε | 0.66 ± 0.09κ | ||
| VSV | 0.18 ± 0.02αβ | 0.19 ± 0.02δε | 0.47 ± 0.09κ | ||
a: Major axis; b: Minor axis; VDIA: Diastolic Volume; VSYS: Systolic Volume and VSV: Stroke Volume.
Data are Mean ± SEM. N = 10. Superscripted letters indicate significant differences between models at same developmental stages (P < 0.05).
