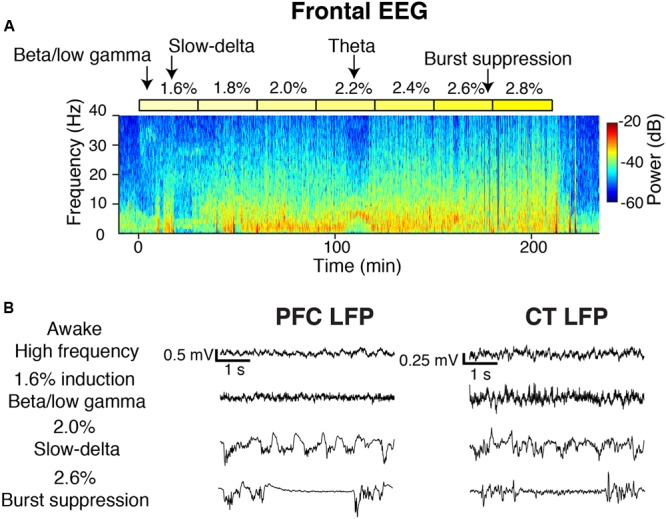
FIGURE 2.

Overview of oscillatory dynamics observed during the 1.6–2.8% sevoflurane ramp. (A) Spectrogram of the frontal EEG from a representative animal during the sevoflurane ramp. Yellow blocks mark periods during which sevoflurane was set to the indicated dose. Arrows point to oscillatory dynamics. From this animal, (B) PFC (left) and CT (right) LFPs from four 5-s periods.
