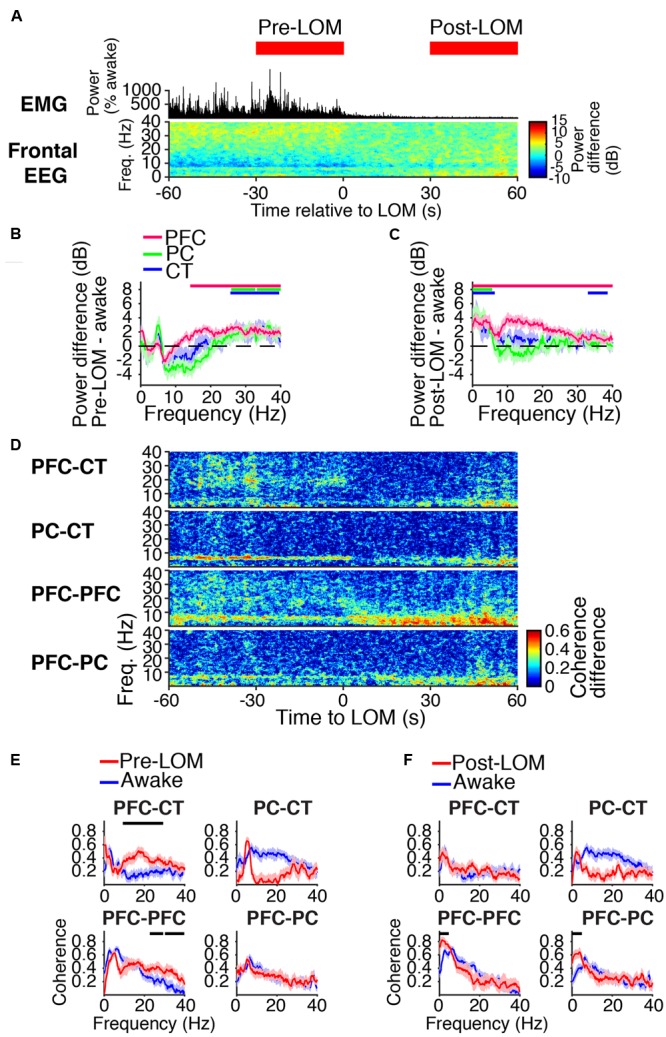
FIGURE 4.

Dynamics around the time of loss of movement. (A) Group EMG power and group difference spectrogram of the frontal EEG aligned to LOM. Red rectangles mark the periods analyzed in (B,C,E,F). (B,C) Group power difference between 30-s periods immediately before (B) or 30 s after (C) LOM and awake baseline for PFC (red), PC (green), and CT (blue) LFPs. Shading indicates 95% confidence intervals. Red, green, and blue horizontal lines mark ranges of significant power increase relative to awake baseline for PFC, PC, and CT LFPs, respectively. (D) Group difference coherograms for pairs of LFPs aligned to LOM. (E,F) Group coherence during awake baseline (blue) and periods before (E) or after (F) LOM (red). Shading indicates 95% confidence intervals, and horizontal lines mark ranges of significant coherence increase from awake baseline.
