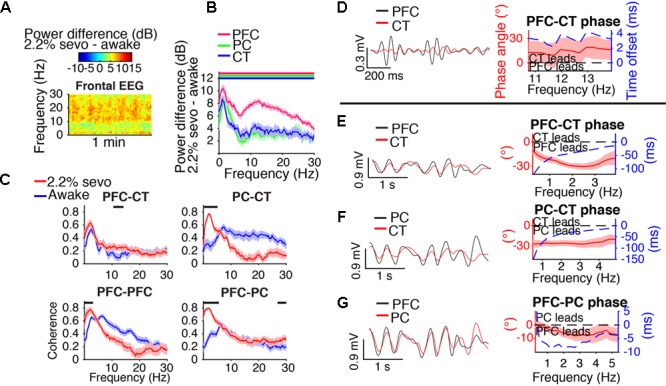
FIGURE 5.

Slow-delta dynamics during 2.2% sevoflurane. (A) Group difference spectrogram of the frontal EEG during slow-delta dominated periods at 2.2% sevoflurane. The same period is analyzed in (B–G). (B) Group power difference between 2.2% sevoflurane and awake baseline for PFC (red), PC (green), and CT (blue) LFPs. Shading indicates 95% confidence intervals. Red, green, and blue horizontal lines mark ranges of significant power increase relative to awake baseline for PFC, PC, and CT LFPs, respectively. (C) Group coherence during the awake (blue) and 2.2% sevoflurane (red) states for pairs of LFPs. Shading indicates 95% confidence intervals, and horizontal lines mark ranges of significant coherence increase from awake baseline. (D–G) Left: LFPs from a representative animal filtered in the frequency range shown in the corresponding plot on the right. Right: Group phase relationship between two LFPs shown in terms of phase angle (left y-axis, red line) and time offset (right y-axis, blue dotted line). A positive phase relationship indicates that the first signal lags the second, and a negative phase relationship indicates that the first signal leads the second. (D) Group PFC–CT LFP phase relationship in the range of significant PFC–CT LFP coherence increase shown in (C). (E) Group PFC–CT LFP phase relationship in the slow-delta range (note: PFC–CT coherence did not significantly increase in this range). (F) Group PC–CT LFP relationship in the range of significant PC–CT LFP coherence increase shown in (C). (G) Group PFC–PC LFP phase relationship in the range of significant PFC–PC LFP coherence increase within the slow-delta range shown in (C).
