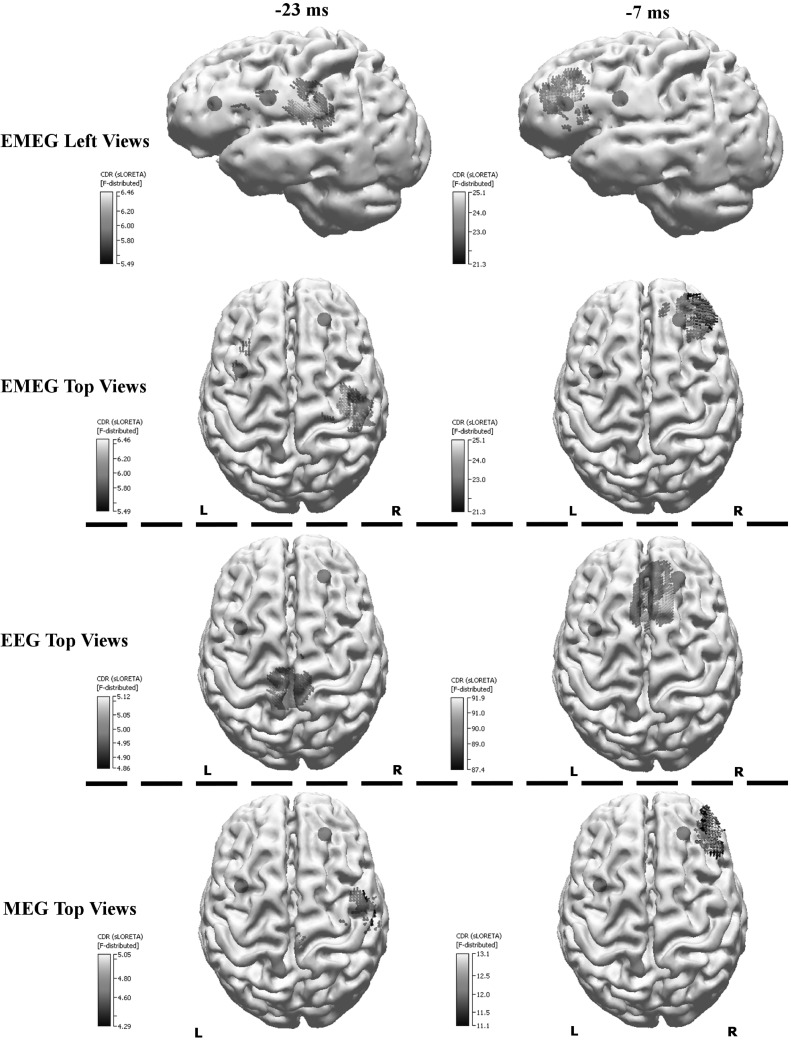
Fig. 10.
EMEG (top two rows), EEG only (third row from the top) and MEG only (bottom row) based source reconstructions at −23 ms (left column) and −7 ms (right column). A threshold of 85% of the maximum F-value was used for the results. The FCDs detected with MRI are indicated by the blue spheres. (Color figure online)

