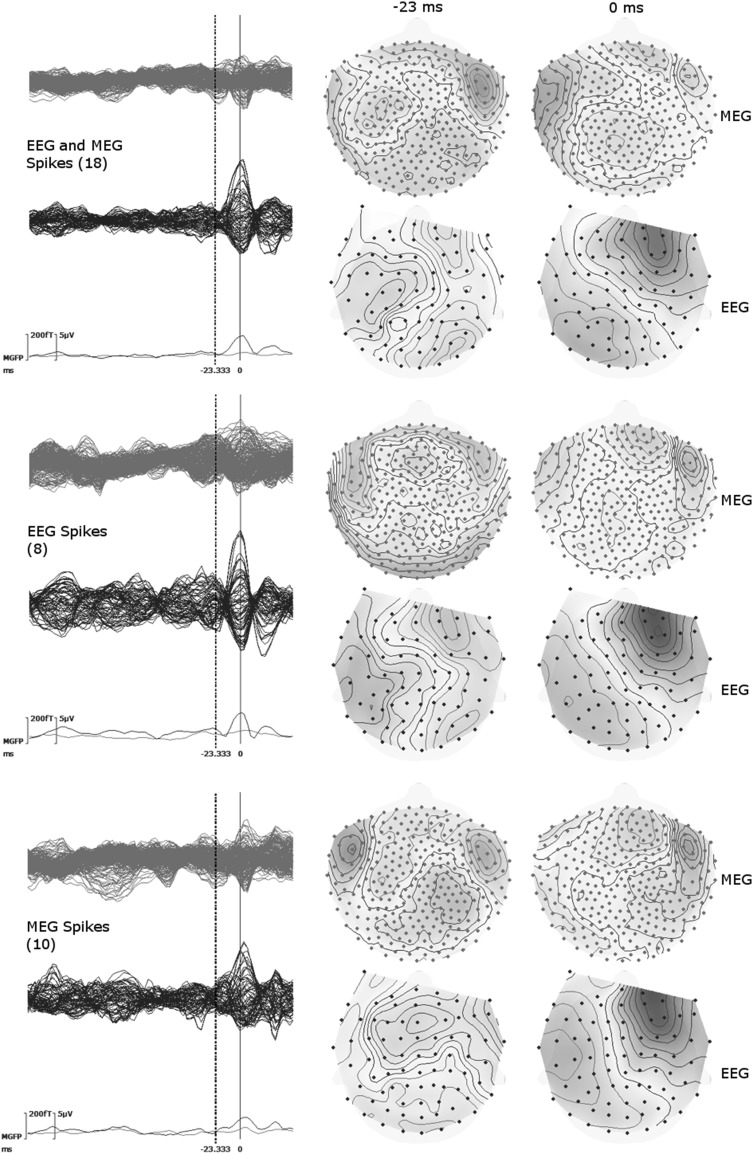
Fig. 4.
Butterfly plots for the averaged signals of spikes marked on EEG or MEG (upper), only from EEG (middle row), and only from MEG (bottom row). The numbers of spikes averaged for each group are given in parentheses. In butterfly plots (left column) MEG is shown by green and EEG by blue lines. MGFP stands for mean global field power and is given for EEG and MEG. The topographies are shown at 0 ms (close to the peak of the spike) and −23 ms (the preceding peak on MEG) as indicated by dashed lines on the butterfly plots. (Color figure online)

