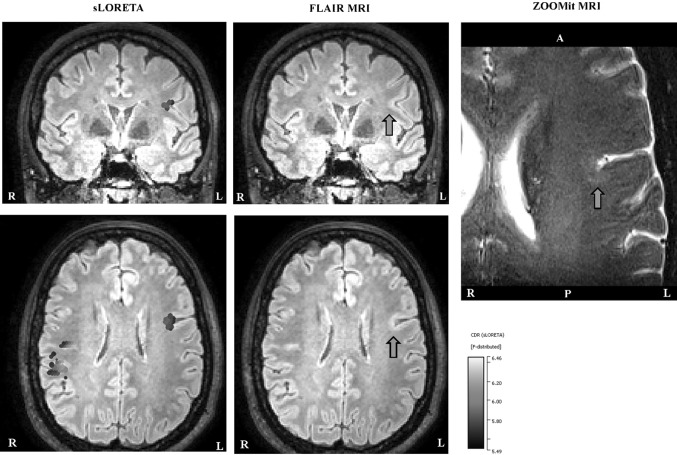
Fig. 7.
EMEG source localizations at −23 ms, slices selected according to the left hemispheric activity. In the left column, the sLORETA results registered to the FLAIR MRI are shown (only results obtained with a threshold of 85% for the maximum F-value are shown). In the middle column, the FLAIR image without localizations is shown, in order to enable the identification of the FCDs (pointed to by green arrows). The right column shows the ZOOMit MRI for the localization cluster (detected with sLORETA) at the left fronto-central region with the green arrow indicating the FCD. White letters on the MRIs show the directions (L left, R right, A anterior, P posterior). (Color figure online)

