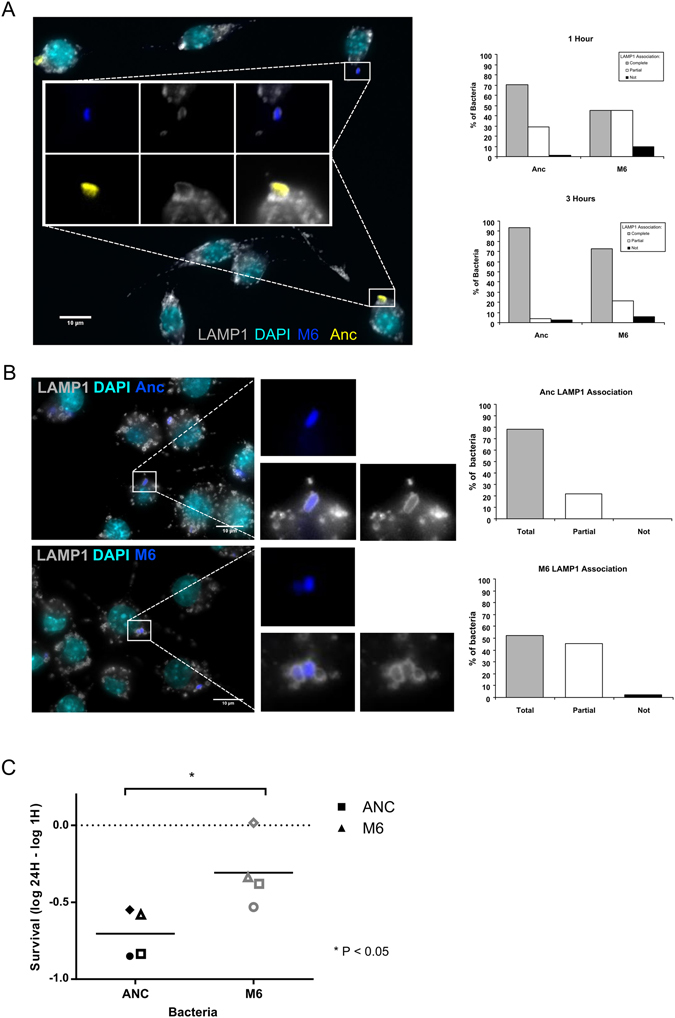
Figure 2.

M6-containing phagosomes mature slower and M6 bacteria show enhanced survival inside macrophages. (A) Representative fluorescence image of MΦs at 1 h post-infection. Anc bacteria are shown in yellow and the M6 evolved clone in blue. LAMP1 is shown in grey and DNA in cyan. Quantification of LAMP1 association at 1 h and 3 h post-infection. Scale bar: 10 µm. (B) Representative fluorescence images of macrophages 1 h post-infection performed in parallel with Anc (top panel) and M6 (lower panel) bacteria. LAMP1 is shown in grey, DNA in cyan and bacteria in blue. Quantification of LAMP1 association at 1 h post-infection is plotted. Scale bars: 10 µm. (C) Survival of Anc and M6 bacteria inside macrophages assessed 24 h post-infection. Each symbol represents one experiment and the bar represents the average survival of four independent experiments. * P < 0.05, Mann-Whitney test.
