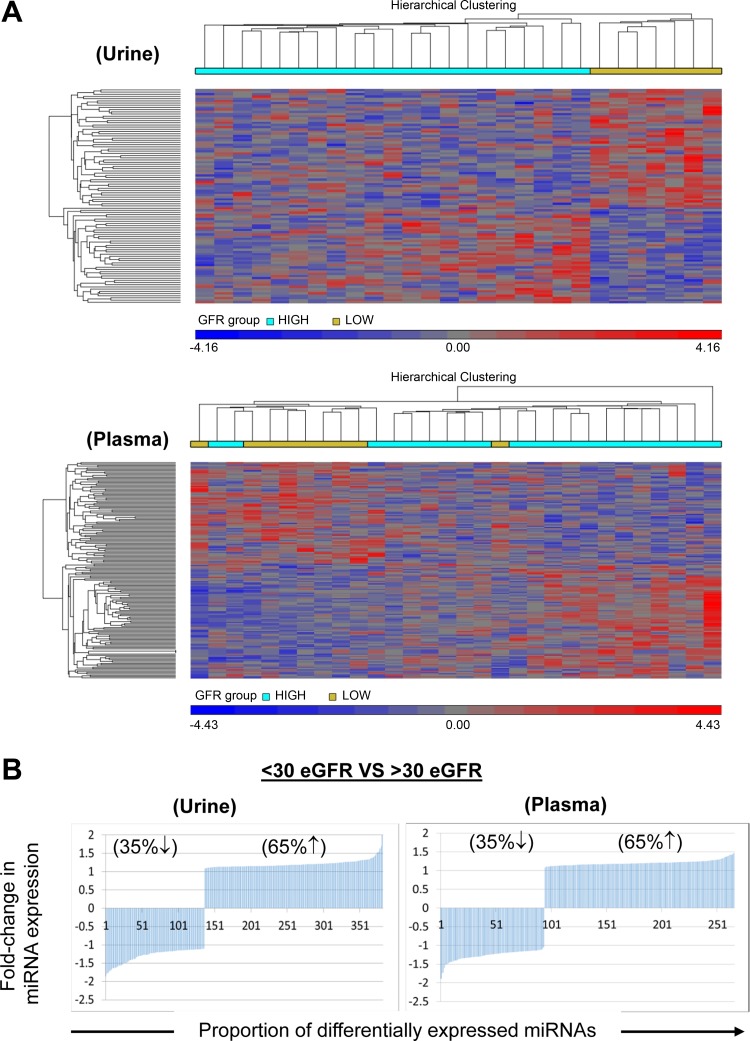
Fig. 2.
Comparative analysis of miRNA expression levels in plasma and urine samples obtained from patients grouped by eGFR. A: heatmap showing unsupervised hierarchical clustering of miRNAs (Pearson correlation, average linkage). Colors represent relative miRNA expression as indicated in the color key for each panel. Brackets on the top margins indicate samples from the same cohort. Samples are in columns, miRNAs in rows. Only miRNAs that survived multiple testing (FDR), and had a fold change >3 or <−3 and P < 0.05 are shown. B: miRNAs with significantly dysregulated expression are graphed for plasma and urine samples. Percentages of up- or downregulated miRNAs are shown with corresponding up or down arrows on each graph.

