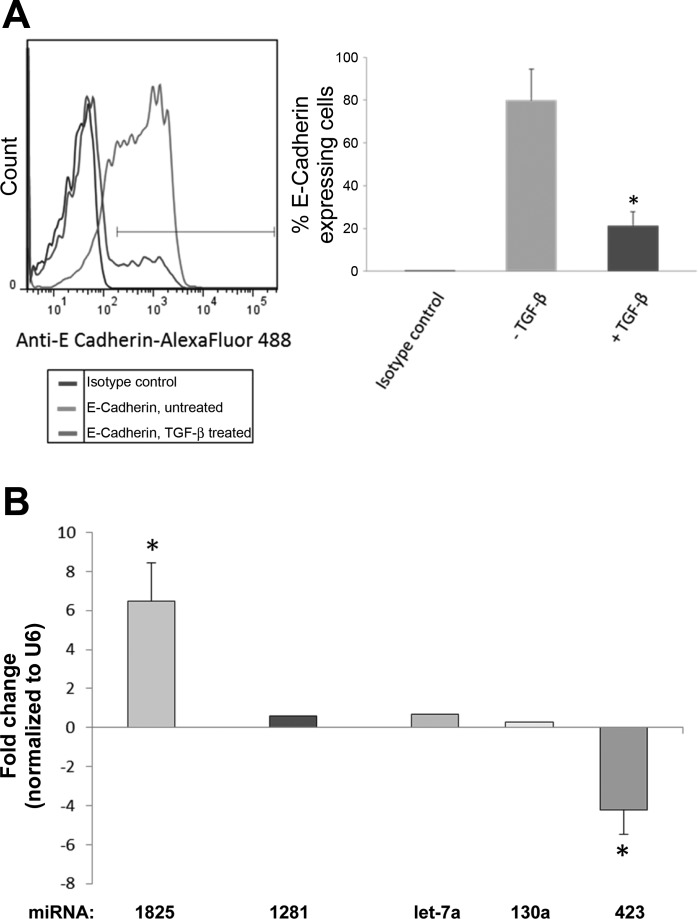
Fig. 6.
A: flow cytometry analysis showing expression of E-cadherin in rat renal proximal tubular cell line (NRK52E) with or without TGFβ stimulation. B: real-time PCR of fibrotic miRNAs in NRK52E cells stimulated by TGFβ. Selected miRNAs were verified using single-well TaqMan qRT-PCR. The 2−ΔΔCt method was used to calculate relative changes in miRNA expression. Results were normalized to levels of U6 snRNA. Each data point represents the mean ± SE. *P < 0.05.

