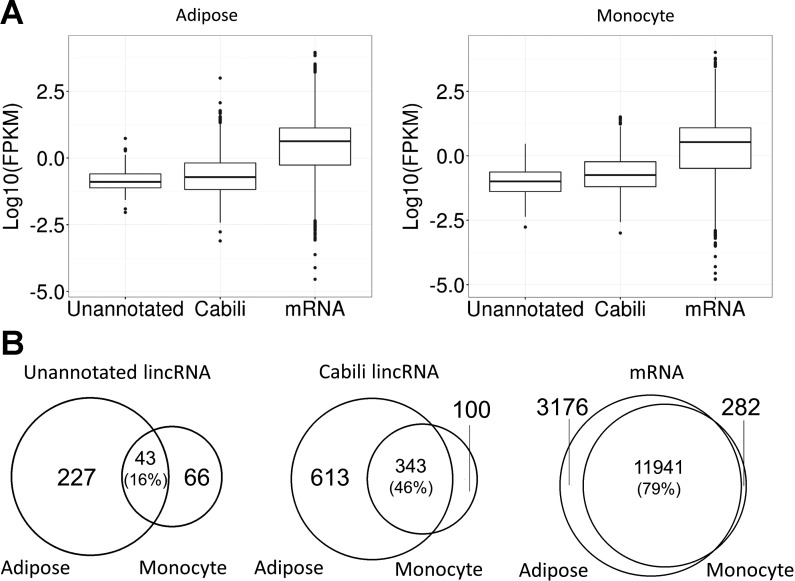
Fig. 2.
LincRNA expression and tissue overlap. A: boxplot showing expression of unannotated lincRNAs, Cabili set lincRNAs (7), and mRNAs. Unannotated lincRNAs had lower expression than Cabili set lincRNAs in adipose tissue (left, Kolmogorov–Smirnov test, P = 2.01 × 10⁻⁹) and in monocytes (right, Kolmogorov–Smirnov test, P = 6.01 × 10⁻⁴). B: tissue specificity of unannotated lincRNAs, Cabili set lincRNAs, and mRNAs. Venn diagram shows the number of unannotated lincRNAs (left), Cabili set lincRNAs (middle), and mRNAs (right) expressed in adipose tissue and monocytes. The percentage of overlap based on the number of adipose lincRNAs are shown in parentheses. LincRNAs, especially unannotated lincRNAs, had higher tissue specificity than mRNAs.

