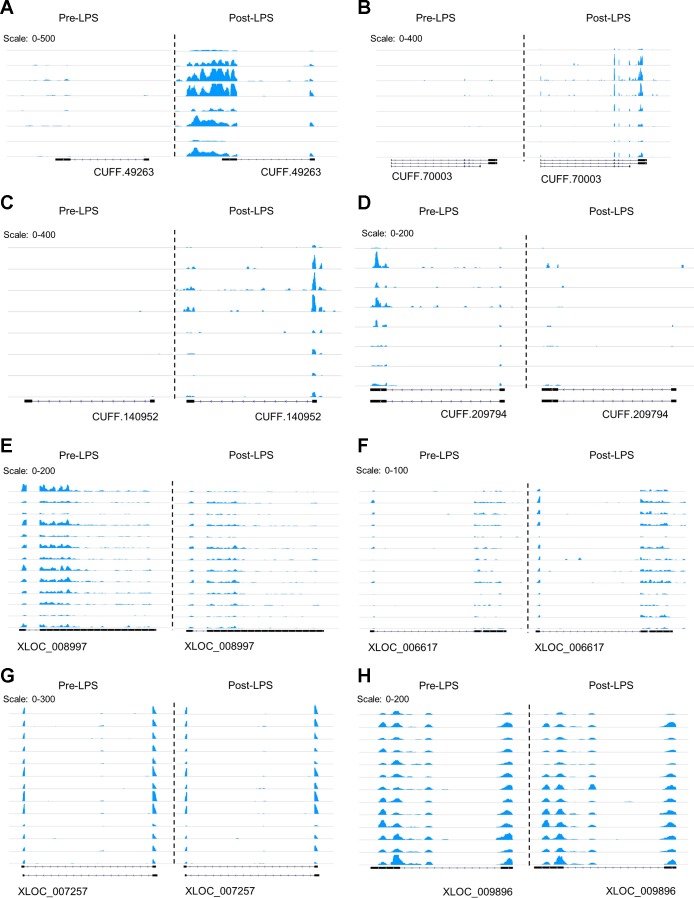
Fig. 10.
RNA-Seq coverage plots of validated unannotated lincRNAs. A–D: RNA-Seq coverage plots of 8 subjects are shown for 4 validated monocyte unannotated lincRNAs. E–H: RNA-Seq coverage plots of 13 subjects are shown for 4 validated adipose unannotated lincRNAs. Each row shows the coverage in pre-LPS and post-LPS on the same scale.

