
Fig. 3.
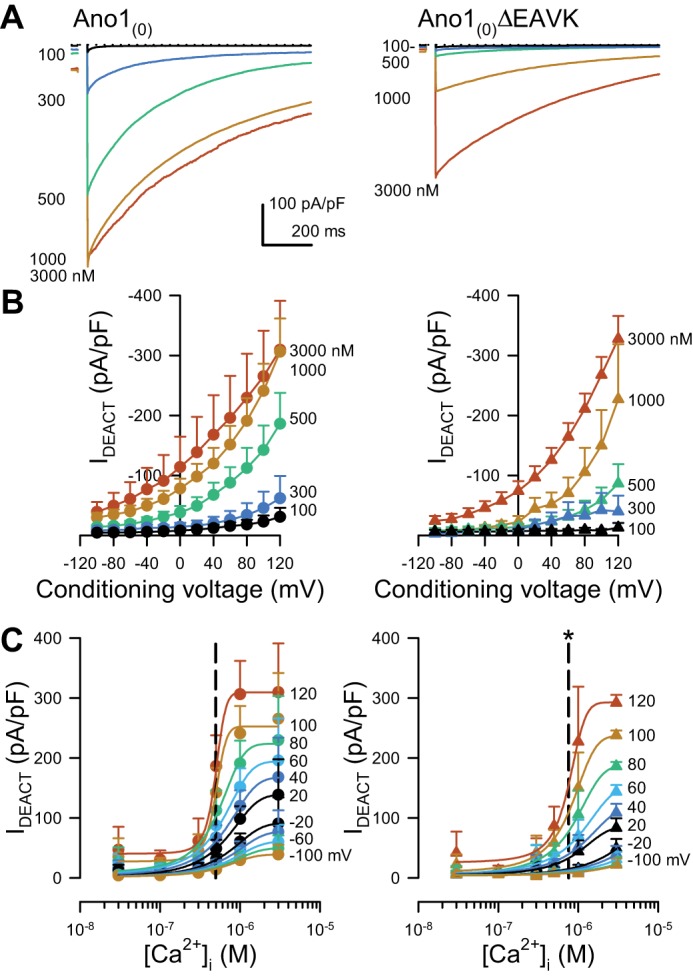
Deactivating currents from the Ano1(0)ΔEAVK splice variant have a higher EC50 of Ca2+ dependence than Ano1(0). A: representative Cl− current traces deactivating from a conditioning voltage step to +80 mV, recorded from HEK293 cells transfected with Ano1(0) (left) or Ano1(0)ΔEAVK (right) and dialyzed with intracellular Ca2+ concentrations ([Ca2+]i) ranging from 100 to 3,000 nM as indicated by the spectrum. Dotted line: 0 pA/pF. B: peak Cl− currents deactivating at the holding voltage (IDEACT) from Ano1(0) (left) or Ano1(0)ΔEAVK (right), plotted vs. the conditioning voltage with 100–3,000 nM [Ca2+]i (spectrum). C: IDEACT from Ano1(0) (left) or Ano1(0)ΔEAVK (right), plotted as a function of [Ca2+]i after the indicated voltage steps (spectrum). EC50 values (dashed lines): Ano1(0), 493 ± 9 nM; Ano1(0)ΔEAVK, 761 ± 26 nM; n = 11, *P < 0.05, compared with Ano1(0) control by an unpaired t-test with Welch’s correction.