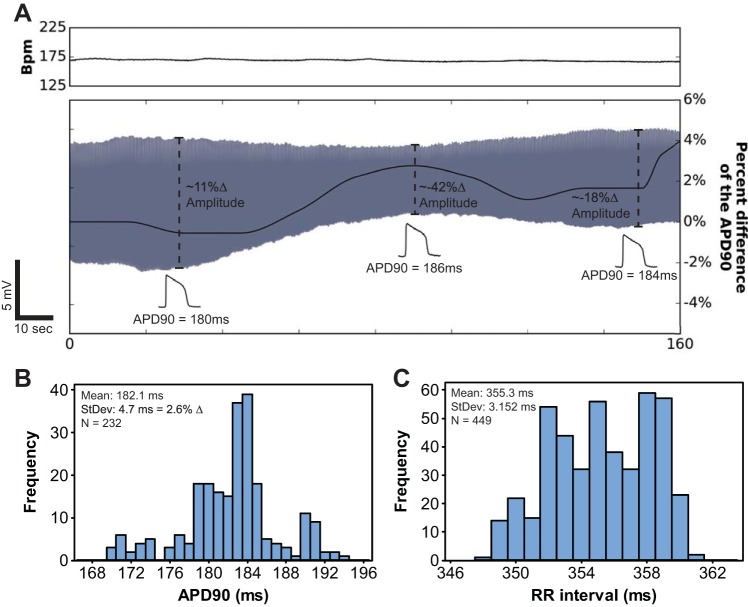
Fig. 2.
AP duration (APD) was stable even if the AP amplitude drifted. A: instantaneous heart rate [in beats/min (bpm)] during normal sinus rhythm was measured from the ECG and is plotted above the simultaneously acquired AP signal (gray) generated by a sharp microdevice embedded in a guinea pig LV. APD measured for each beat is plotted in black on top of the AP signal. This image illustrates an extreme example of AP amplitude drift. These data address a potential limitation of microdevice recordings, which is that consistent AP amplitudes within the setting of significant contractile motion were sometimes difficult to achieve. However, for this 160-s signal, APD at 90% repolarization (APD90) fluctuated no more than 4%, with a SD of 2.6%. B: even though amplitudes drifted by as much as 42% (A), the level of APD fluctuation was small compared with APD changes observed during metabolic perturbations, such as those shown in Fig. 3. C: histogram of RR intervals for the heart rate signal shown in A. This indicates that APD fluctuations could be attributed to subtle changes in heart rate.

