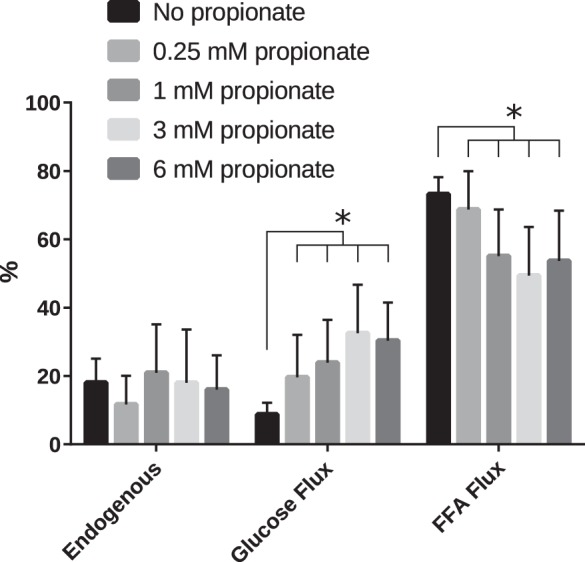
Fig. 4.

Contribution of fluxes through different pathways to the total TCA cycle flux expressed as percentages. *Significant changes (P < 0.05). Significance was established using the ANCOVA model including O2 consumption. Even the lowest concentration of propionate significantly upregulated glucose oxidation.
