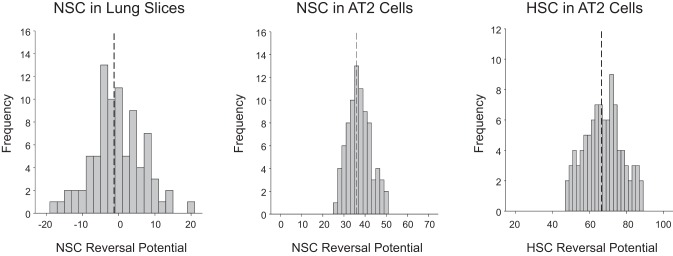
Fig. 10.
Distribution of reversal potentials for NSC in lung slices and distribution in cultured AT2 cells. Left: distribution of reversal potentials for NSC in lung slices [−1.28 ± 7.13 mV (mean ± SD), n = 84]. Middle: distribution of NSC in cultured AT2 cells. Right: distribution of HSC in cultured AT2 cells. The distributions in cultured cells suggest an apical membrane potential near −40 mV and much lower channel activity (mean number of channels/patch is <1).

