Fig. 5.
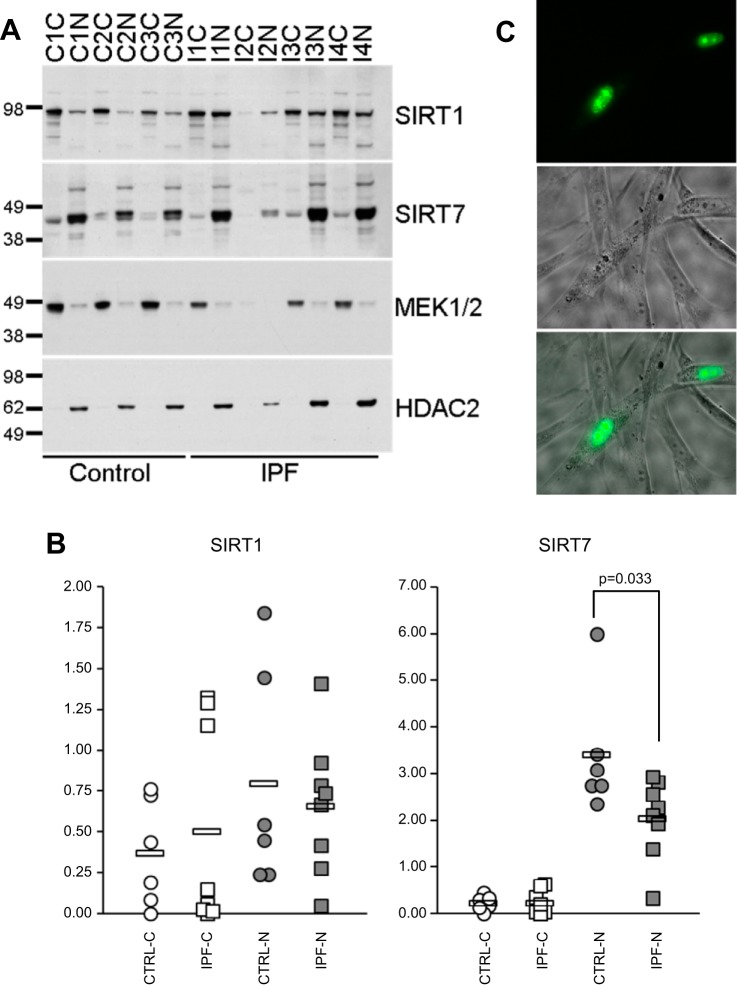
Nuclear and cytoplasmic distribution of SIRT1 and SIRT7 in primary fibroblasts. Primary lung fibroblasts from six patients with IPF, two patients with SSc-ILD, and six healthy controls were cultured for 4–6 passages, cytoplasmic and nuclear fractions were isolated, and protein levels of SIRT1 and SIRT7 were measured by Western blot analysis in each cellular compartment. A: Western blots showing SIRT1 and SIRT7 protein levels in the cytoplasm (C) and nucleus (N) for three healthy controls (C1–C3) and four patients with IPF (I1–I4). MEK1/2 and histone deacetylases 2 (HDAC2) antibodies were used to control for sample loading of the cytoplasmic and nuclear fractions, respectively. B: SIRT1 and SIRT7 densities for cytoplasmic and nuclear fractions of all samples tested, including three controls and four patients with IPF shown in A. The density of each sample was subtracted from the background density and normalized to MEK1/2 for cytoplasmic fractions and HDAC2 for nuclear fractions. Circles indicate control samples, and squares indicate patient samples. Open circles and squares indicate cytoplasmic fractions, while gray circles and squares indicate nuclear fractions. Horizontal bars indicate average values. P values were calculated using the Mann-Whitney U-test; the significant difference in SIRT7 levels between control and patient fibroblast nuclei is indicated. C: normal human lung fibroblasts overexpressing SIRT7-GFP and viewed under a fluorescent microscope with ×40 objective 24 h after transfection. Top subpanel shows the green fluorescence image, middle subpanel shows phase contrast image, and bottom subpanel shows fluorescent and phase contrast images merged. Note that SIRT7-GFP is localized to the nucleus with greater intensity in the nucleoli.

