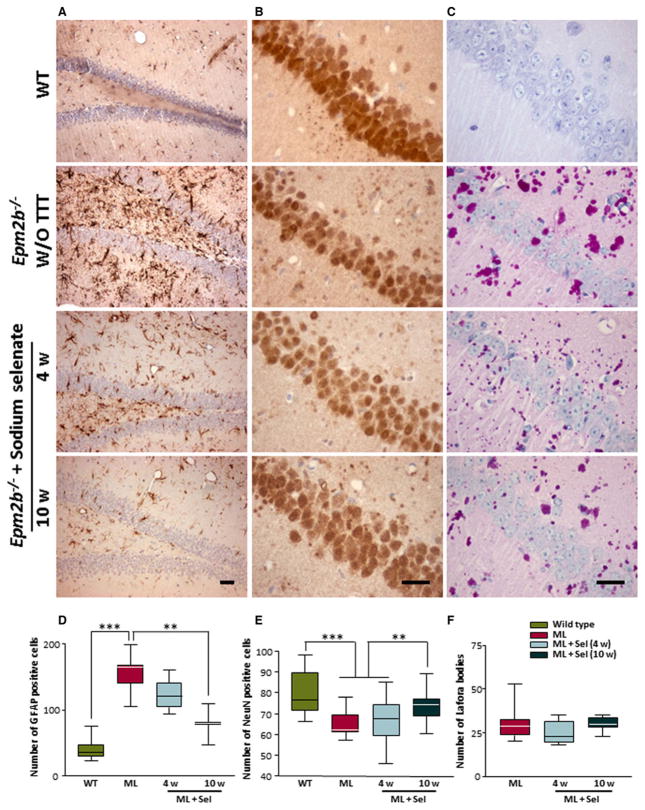
Figure 5.
Neuronal loss, gliosis and Lafora bodies in the hippocampus of Epm2b−/− mice after treatment with sodium selenate. Images of representative immunostained sections from dentate gyrus with GFAP (A) and from CA1 with NeuN (B) and PAS staining (C) are shown from wild-type, Epm2b−/−, and Epm2b−/− after selenate treatment for 4 and 10 weeks (scale bars 25 μm). Graphs show the quantification of GFAP-positive cells (D), NeuN-positive cells (E), and PAS+ inclusions (F) in wild-type, Epm2b−/−, and Epm2b−/− after sodium selenate treatment for 4 or 10 weeks. Visual blinded quantification was performed in the dentate gyrus and CA1 regions of the hippocampus. Both hemispheres of the brain were quantified in three mice of each group. One-way ANOVA was performed for statistical analysis. *p < 0.05; **p < 0.01; ***p < 0.001. ML, malin-deficient mouse; Sel, sodium selenate.

