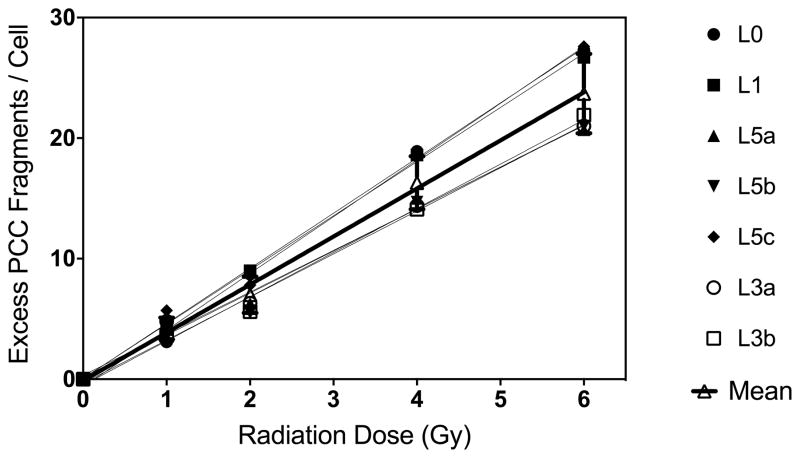
Figure 2.
Comparative results obtained from the analysis of gamma-rays induced excess PCC fragments in human lymphocytes for the construction of “immediate” dose-response curves. (Mean curve in black bold line: linear, α=3.9±0.13 and β=−0.12) Same 10 digitally captured PCC images per dose point were sent to and scored by each laboratory. [L0 and L1 one scorer each; L3 two scorers, and L5 three scorers].

