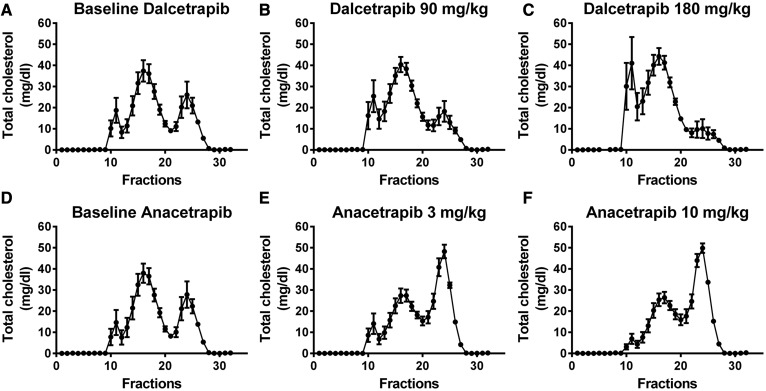
Fig. 3.
Impact of dalcetrapib and anacetrapib on monkey FPLC lipid profile. Monkeys were treated or not treated with dalcetrapib (90 or 180 mg/kg) (A–C) and anacetrapib (3 or 10 mg/kg) (D–F). Lipoprotein classes were separated by FPLC and TC concentrations were obtained in each fraction. Results are presented as mean of n = 7 monkeys.

