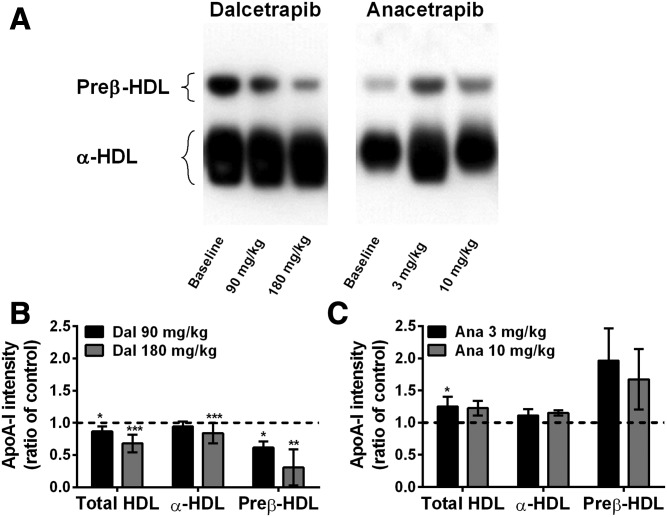
Fig. 5.
Impact of dalcetrapib (Dal) and anacetrapib (Ana) on vervet monkey apoA-I distribution in HDL subclasses. Monkeys (n = 7) were fed a diet containing dalcetrapib (90 or 180 mg/kg) or anacetrapib (3 or 10 mg/kg). At the end of treatment, plasma was subjected to agarose gel electrophoresis followed by apoA-I Western blot detection. A: Representative Western blot of monkey plasma apoA-I detection. B, C: Densitometric quantification of preβ- and α-HDL levels detected by agarose gel electrophoresis in monkeys receiving dalcetrapib (B) or anacetrapib (C). Ratio calculated from band intensity of each HDL subclass for each drug versus band intensity in the baseline. *P < 0.05, **P < 0.01, ***P < 0.001 versus control.

