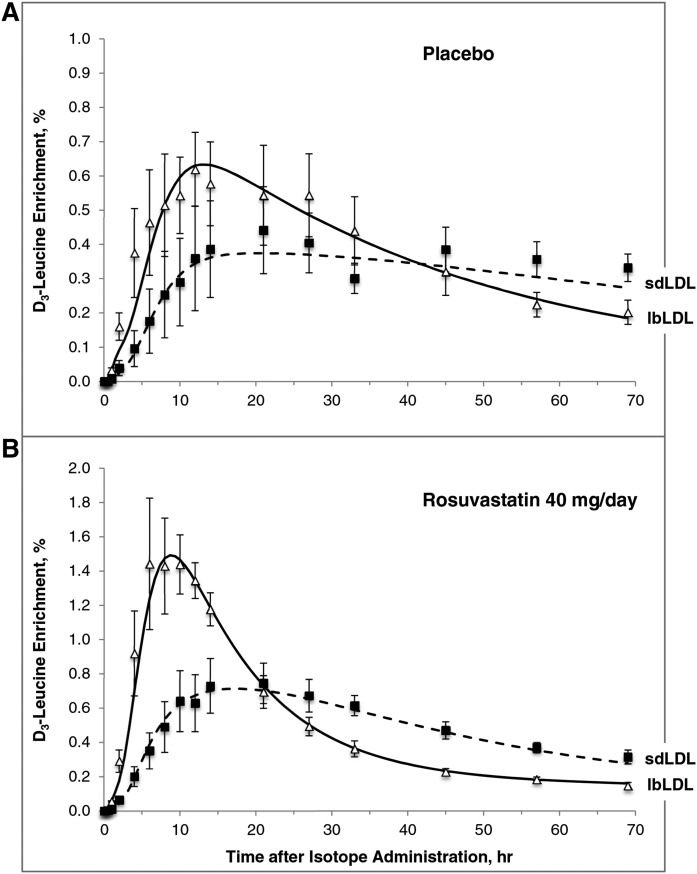
Fig. 3.
D3-leucine percent enrichment of apoB-100 in lbLDL and sdLDL during the placebo (A) and rosuvastatin 40 mg/day (B) phases. The graphs depict the fit of the model to the enrichment data derived from the GC/MS analysis. The points represent enrichment (mean ± SEM, n = 6); lines denote the model-predicted values. Open triangles and solid line indicate apoB-100 in lbLDL; filled squares and dashed line indicate apoB-100 in sdLDL.

