Fig. 3.
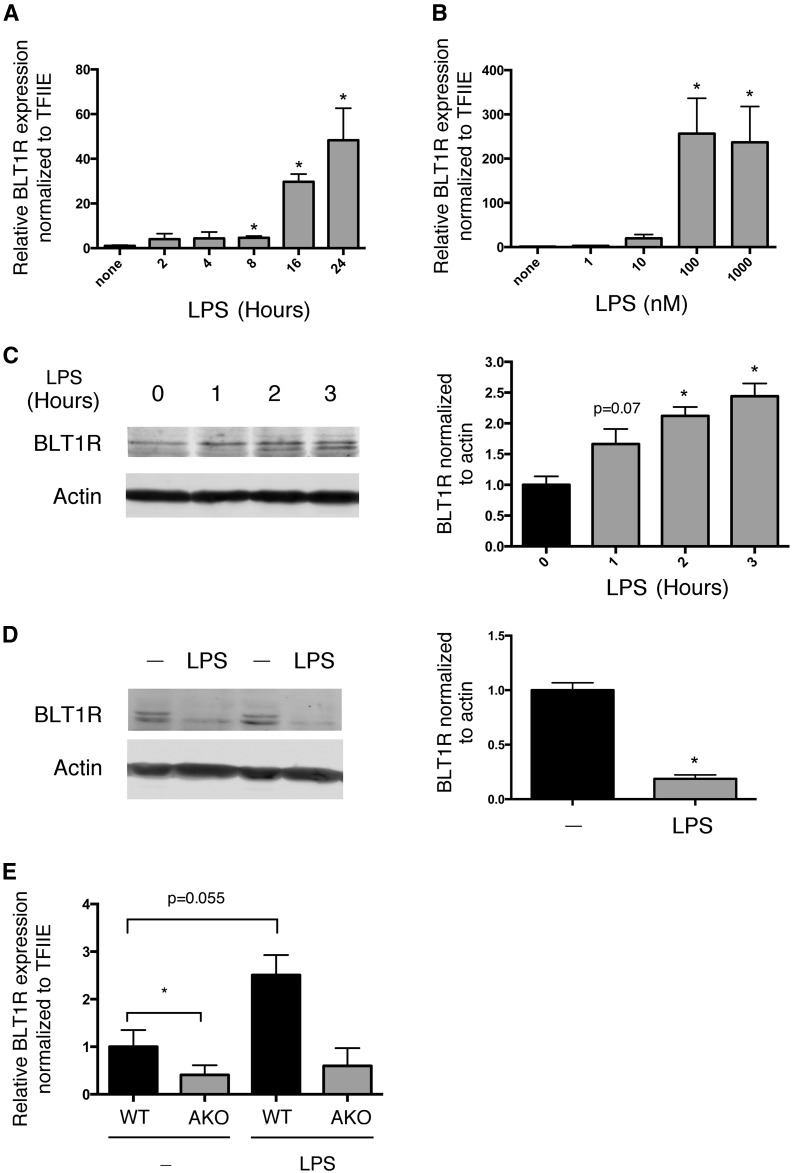
LPS regulates BLT1R expression. A: Time course (2–24 h) of BLT1R mRNA expression in RAW264.7 macrophages treated with LPS (100 ng/ml). B: Expression of BLT1R mRNA in response to a 24 h concentration course of LPS. C: Expression of BLT1R protein in response to short-term LPS (100 ng/ml) treatment (0–3 h). D: Expression of BLT1R protein in response to 24 h of LPS (100 ng/ml) treatment. E: BLT1R mRNA expression in WT and AKO macrophages under basal conditions and in response to LPS (100 ng/ml) treatment for 24 h. Data were analyzed by Student’s t-test. *P < 0.05 as compared with no treatment (A–D). *P < 0.05 AKO compared with WT (E).

