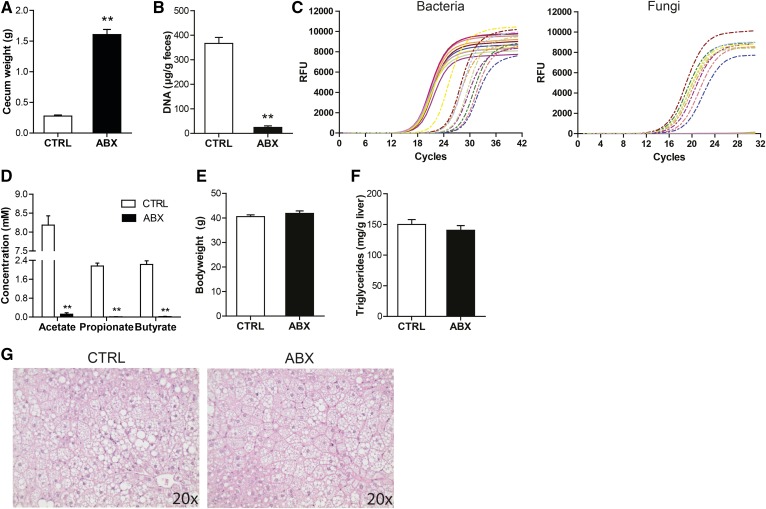
Fig. 9.
Suppression of the gut bacteria using antibiotics does not affect hepatic steatosis. A: Weight of the cecum. B: Quantitative analysis of fecal DNA levels. C: qPCR amplification plot for 16S rRNA gene and fungal ITS1-5.8S-ITS2 region in equal amounts of fecal DNA. Solid lines indicate CTRL mice and dashed lines indicate ABX mice. D: Cecal SCFA concentration. E: Final bodyweight of mice fed CTRL diet with or without antibiotic supplementation. F: Quantitative analysis of liver triglyceride levels. G: H&E staining of representative liver sections. Data are presented as mean ± SEM. Asterisks indicate significantly different compared with CTRL. **P ≤ 0.001.

