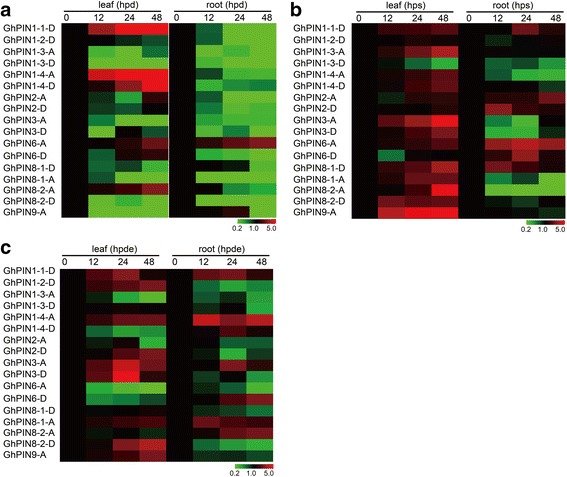
Fig. 5.

Gene expression analysis of GhPINs after abiotic stresses treatments. a Fold changes of GhPIN gene expression under drought treatment. b Fold changes of GhPIN gene expression under salt treatment. c Fold changes of GhPIN gene expression under dehydration treatment. All treatments were performed with three biological and three technical replicates. Hpd, hours post drought; hps, hours post salt; hpde, hours post dehydration. The relative gene expression levels were determined using cotton UBQ7 as a control
