
Figure 2.
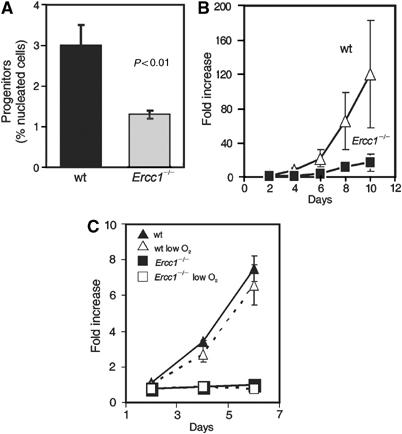
Decreased hematopoietic progenitors in Ercc1−/− mice. (A) Progenitors were isolated from 3-week-old Ercc1−/− mice and wt littermates and directly counted. The mean (±s.e.m.) for five pools of mice (2–4 mice per pool) is plotted. (B) Progenitor cells were cultured in a cytokine-rich environment to stimulate maximal proliferation. Every 2 d, cells were counted and the results plotted as fold increase from day 0. Each point represents the mean (±s.e.m.) of at least three samples. (C) Total BM was isolated from 3-week-old mice and plated with lineage-specific cytokines under 20 or 3% (low) oxygen. Progenitor numbers are expressed as fold increase from day 1. Each point represents the mean (±s.e.m.) of three mice.