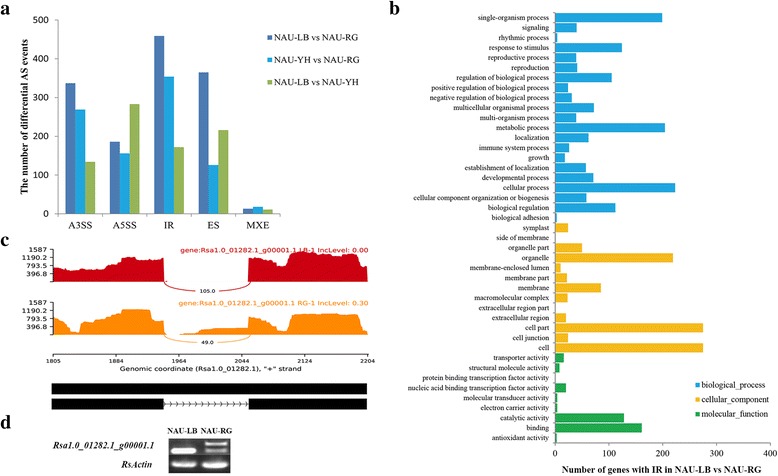
Fig. 3.

Characterization of differential splicing events in three genotypes. a Distribution of differential splicing events in three pairwise comparisons. b Gene ontology classification of genes with differential IR events in ‘NAU-LB’ vs ‘NAU-RG’. c Reads distribution of Rsa1.0_01282.1_g00001.1 derived from RNA-Seq data of ‘NAU-LB’ and ‘NAU-RG’. The horizontal and vertical axis represents per-base expression and genomic coordinates, respectively. mRNA isoform quantified is given at the bottom, black box and line with arrow heads represents exon and intron, respectively. d Validation of Rsa1.0_01282.1_g00001.1 with differential IR event in the ‘NAU-LB’ and ‘NAU-RG’ comparison by RT-PCR
