
Figure 2.
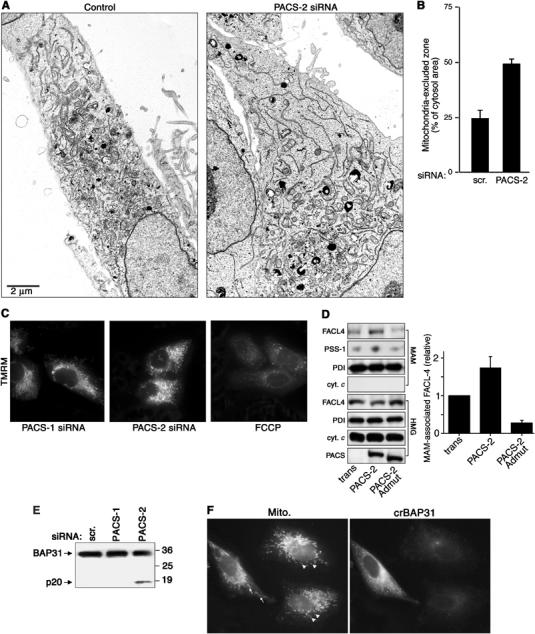
PACS-2 depletion disrupts mitochondrial structure. (A) A7 cells were transfected or not with the PACS-2 siRNA and processed for electron microscopy. Magnification, × 4500. (B) The extent of uncoupling of mitochondria from the ER of either control cells or PACS-2-depleted cells was quantified using morphometric analysis (see Materials and methods). (C) Cells were incubated with 100 nM TMRM for 30 min before microscopic analysis. Control cells were treated with 10 μM FCCP for 30 min, which uncouples the ΨM and blocks TMRM loading. (D) MAMs were isolated from crude homogenates (HMG) of control cells (trans) and PACS-2- and PACS-2Admut-expressing cells by Percoll gradient fractionation, and identified by Western blot using an anti-PSS-1 Ab, which is specific for the MAM fraction (Stone and Vance, 2000). The effect of PACS-2 or PACS-2Admut on the localization of MAM-associated FACL4 was determined by Western blot. Right: Quantitation of MAM-associated FACL4 (n=3). (E) Lysates from control and siRNA-transfected A7 cells were analyzed by Western blot using anti-BAP31. (F) A7 cells were transfected with crBAP31-flag and subsequently transfected with the PACS-2 siRNA for 48 h. Cells were then processed for immunofluorescence with anti-Flag mAb to detect crBAP31-expressing cells (right panel) and mitotracker (left panel). Arrows, rod-like mitochondria. Arrowheads, fragmented mitochondria.