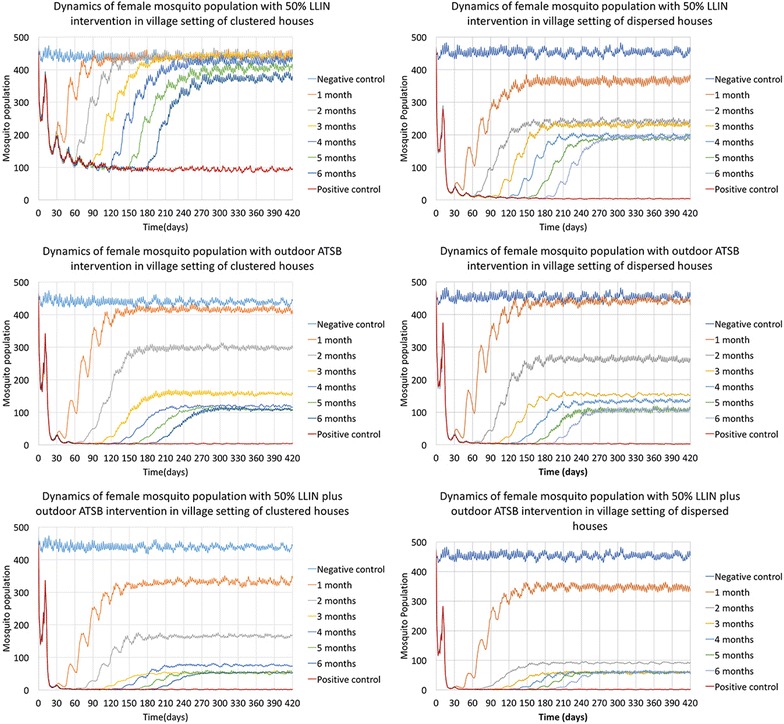
Fig. 1.

Dynamics of female mosquito population with different intervention types and efficacy periods in clustered and dispersed village settings. The two columns of figures show the dynamics of female mosquito populations in village setting of clustered houses (on the left) and dispersed houses (on the right). The first row of figures shows results of 50% LLIN intervention, the second row shows results of outdoor ATSB intervention, and the third row shows results of 50% LLIN plus ATSB intervention. In all six figures, the y-axis represents the mean number of female An. gambiae mosquitoes at each day, and the x-axis shows the time in days. Day 0 is the day that the intervention was applied. The lines in different colors represent different simulated efficacy periods for each intervention
