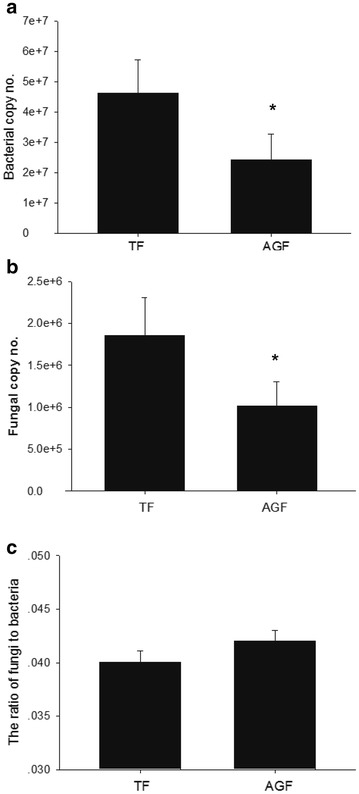
Fig. 2.

Copy numbers of bacteria (a), fungi (b) and the ratio of fungi to bacteria (c). TF and AGF refer to soil samples from traditional farmland and American ginseng farmland, respectively. The value of each bar represents the mean ± SD of n = 3. An asterisk denotes a significant difference between TF and AGF at P < 0.05
