
Fig. 2.
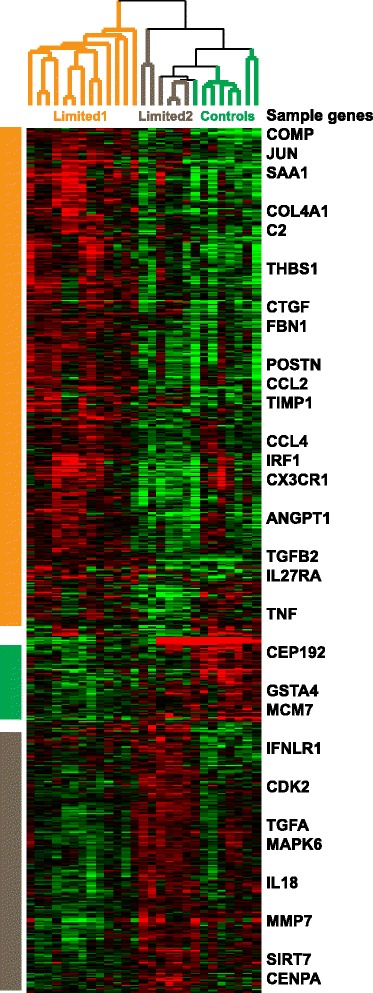
Multiclass significance analysis of microarrays (SAM) between the three identified clusters. Multiclass SAM was used to identify 807 differentially expressed genes (false discovery rate <10%) between limited -1, limited -2 and healthy control samples. Sample genes are listed. The majority of differentially expressed genes (475/807, 58.9%) had increased expression in the limited-1 group