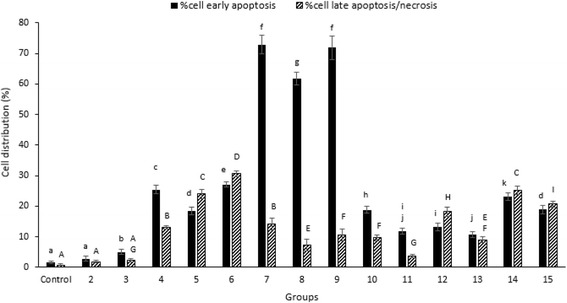
Fig. 3.

Percent of apoptotic and necrotic effects on the Caco-2 cells treated with B. subtilis ATCC 6633 or PY79 stains and different forms of C. perfringens using flow cytometry assay. Bars represented SD values of triplicates. Different small and capital letters on the bars, representing significant differences for apoptotic and necrotic cells, respectively (P < 0.05). Groups are described in Table 1
