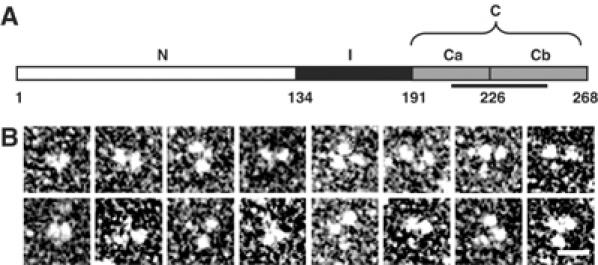
Figure 1.

Molecular organization of human EB1. (A) Schematic representation of the domain organization of human EB1. Domains N, I, and C (subdivided in Ca and Cb) are depicted in white, black, and gray, respectively. Corresponding domain boundaries are indicated by residue positions. The unique EB1-like sequence motif is highlighted by a line. (B) High-magnification TEM gallery of glycerol sprayed/rotary metal shadowed EB1 specimens. Scale bar, 10 nm.
