
Fig. 1.
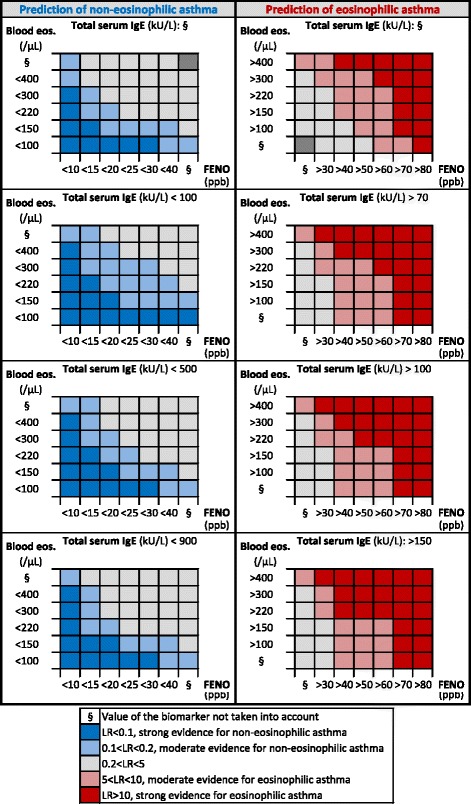
Representation of the strength of the likelihood ratio to predict non-eosinophilic (left panel) or eosinophilic (right panel) asthma according to several thresholds of FENO, blood eosinophils, total IgE or their combination. Each square of the Figure represents a subgroup of at least 20 patients. Abbreviations: Blood eos blood eosinophils, FENO fractional exhaled nitric oxide, IgE immunoglobulin E