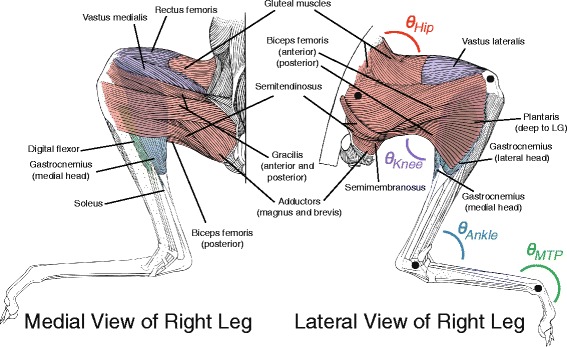
Fig. 1.

Diagram of the muscles considered in this analysis. Muscles are colored according to the joint at which they primarily act. Joint angles are defined such that θ increases as the arc represented elongates, and black circles indicate approximate centers of rotation for each joint. Anatomical sketches of limb muscles are adapted from drawings by Howell [16]
