Fig. 1.

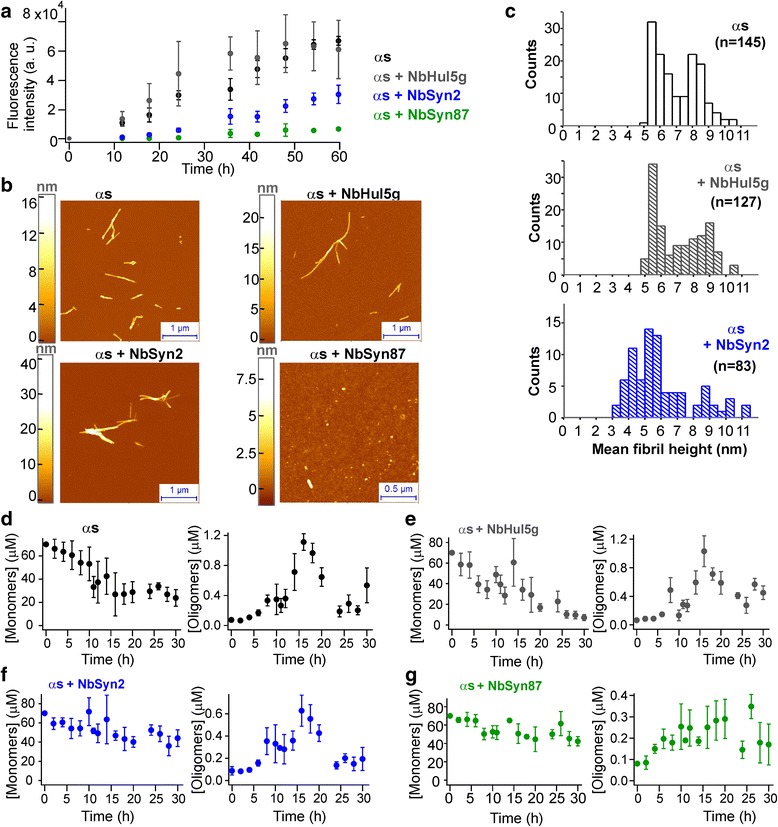
Aggregation kinetics of 70 μM ɑS in the absence and presence of nanobodies. a Bulk kinetic profiles of fibril formation, monitored by ThT fluorescence (n = 3, mean ± SEM). b Representative AFM images of the samples where the aggregation reaction had reached steady state (107 h); images of the samples prior to initiation of the aggregation reaction are shown in Additional file 1: Figure S1a. c Histograms representing the values of average fibril heights from AFM analysis. Scatter plots and statistical comparisons of these distributions are given in Additional file 1: Figure S1c. d sm-FRET kinetic profiles derived from monomer depletion (n = 6, mean ± SEM) and oligomer formation (at least n = 3, mean ± SEM) of ɑS at 70 μM in aqueous buffer, in the presence of 140 μM of the control NbHul5g (e), and in the presence of ɑS-specific nanobodies (f and g)
