Fig. 2.

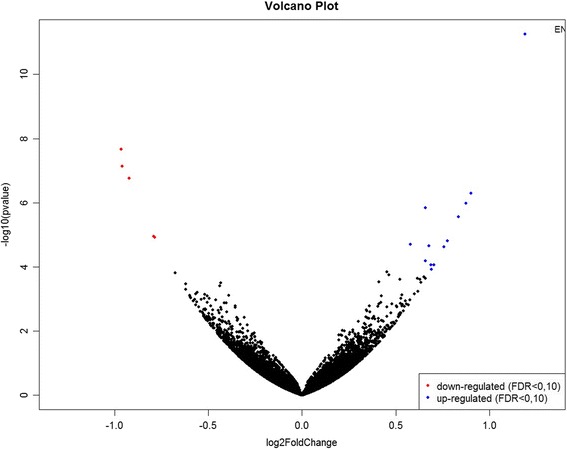
Volcano plot of log2FoldChange (x-axis) versus –log10 p value (FDR-corrected, y-axis) of high and low genomic breeding value groups for backfat thickness in Nellore steers with FDR 10%

Volcano plot of log2FoldChange (x-axis) versus –log10 p value (FDR-corrected, y-axis) of high and low genomic breeding value groups for backfat thickness in Nellore steers with FDR 10%