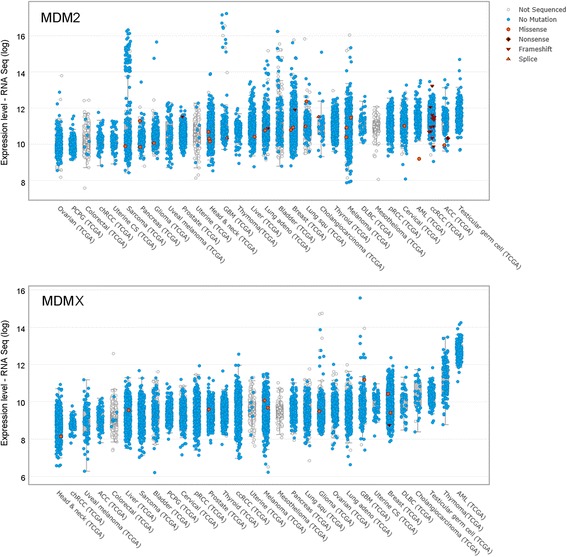
Fig. 1.

Expression levels of MDM2 and MDMX in human cancers. Graphical representation of the expression levels of MDM2 (upper panel) and MDMX (lower panel) in human cancers obtained from studies collected in cBioPortal For Cancer Genomics (www.cbioportal.org). The picture shows RNA values of patients expressing the wild-type or mutated genes. TCGA The Cancer Genome Atlas Network
