Fig. 1.

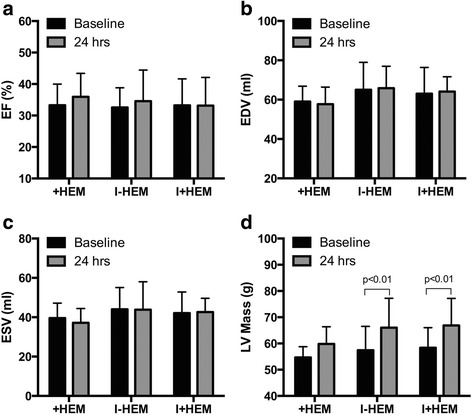
Cardiac Function. Plots demonstrate cardiac function parameters - (a) ejection fraction (EF), (b) end-diastolic volume (EDV), (c) end-systolic volume (ESV) and (d) left ventricular (LV) mass at baseline and 24 h post intervention in the three animal groups. Only LV mass was significantly elevated at 24 h in the 45 min occlusion groups (I-HEM, I+HEM) indicative of inflammatory swelling
